Water Science
Explore each water quality parameter in more depth and understand your monthly citizen-science monitoring
Delving Into The Data webinar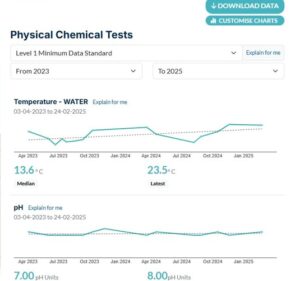
Explore the River Detectives website and WaterWatch data portal with statewide WaterWatch facilitator Justine Holmes to learn how to retrieve, interpret, compare and share the waterway data you collect along with data collected by the network of River Detectives schools and WaterWatch volunteers across the state.
|
Students create an early flood warning system for their town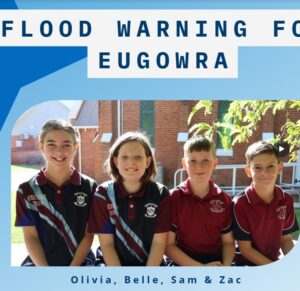
Young St Joseph’s PS students from Eugowra NSW have developed an early flood warning system for Eugowra after unprecedented floods devastated their town in 2022. They presented their project to expert adults from around the country at the Floodplain Management Australia national conference in Melbourne in May 2025. Their inspiring video is such as great example of student-led inquiry-based practical learning, community collaboration and advocacy, innovation to create an early flood warning system and a powerful way for these students to alleviate some of the trauma they lived through.
|
Blackwater pros and cons video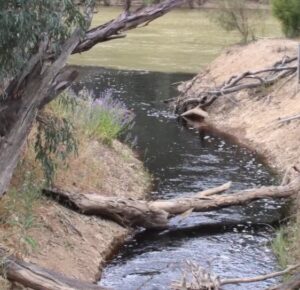
At the right time of year, good blackwater is nature’s gum-leaf tea and is huge boost for our rivers, creeks and fish. In the wrong conditions, blackwater can be toxic. Learn more with this video. And to learn how environmental water releases can help minimise the impacts of blackwater watch this video.
|
From River Detective students to WaterWatch volunteers video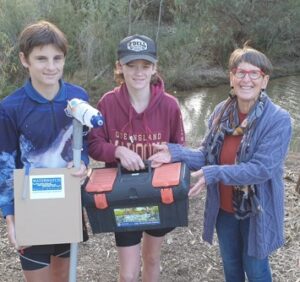
A lovely story about the pathway from the River Detectives program to WaterWatch volunteering, highlighting the importance of fostering care for nature in the next generation and the future opportunities for River Detectives students.
|
The pH scale explained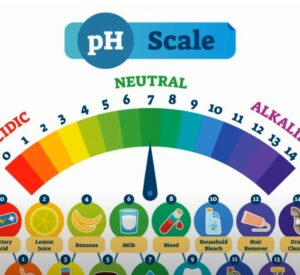
A great explanation of the pH scale, acidity and alkalinity in relation to everyday objects. Please note; alkaline substances are referred to as ‘bases’ in this video. The acidity and alkalinity of substances are related to taste in the video – be clear with students that they should NOT be tasting anything that is not food.
|
Tullaroop Catchment Project River Health Snapshot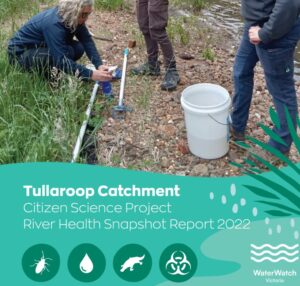
Gauge the health of waterways in the Tullaroop Catchment project area using this compilation of water quality and water bug data collected by citizen-scientists.
|
What is environmental DNA (eDNA) ? video
This short video explains how eDNA can help us detect native and invasive species by providing evidence about what is or isn’t present in the environment – it’s like nature’s genetic fingerprint ! eDNA testing is innovative technology that enables the detection of species without having to see, hear or catch them. eDNA offers an unprecedented opportunity for monitoring endangered and invasive species, as well as for biodiversity assessments.
|
River Detectives data entry instructional video
Watch this video to help you enter your water quality data into the River Detectives data portal or use this illustrated guide.
|
Frank Steele’s volunteer video story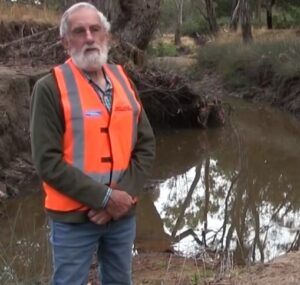
To celebrate the Waterwatch Program’s 30th anniversary, Frank Steele shares why he has enjoyed volunteering as a water quality monitor for the past 11 years. His story highlights the value in monitoring intermittent waterways and collecting photos, even in dry times, as a way of tracking change over time and measuring climate change. To read the written story click here.
|
Pesticide Watch
In 2024 some schools will value add to their monthly water quality monitoring by opting in to participate in Pesticide Watch, a nation-wide program run by Brady Hamilton at Deakin University helping communities identify pesticides in their local waterways through citizen-science. Find out more about the program by watching this video, about the testing procedure by watching this video, about the sampling protocol in this guide or watching this webinar we recorded with Brady all about pesticides and the research project. The 2023 results have been published in this summary report. For pesticide teaching resources click here or to follow the project join the Pesticide Watch Facebook Page. You can contact Brady Hamilton from Deakin University directly; brady.hamilton@deakin.edu.au
|
Caring For The Campaspe Project River Health Snapshot 2021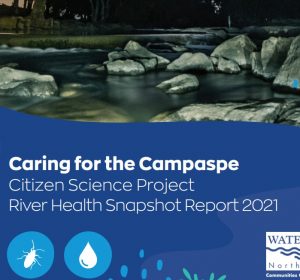
Gauge the health of waterways in the Campaspe River using this compilation of water quality and water bug data collected by citizen-scientists.
|
Deans Marsh PS River Detectives Story
Deans Marsh PS is an active River Detectives school in the Corangamite CMA region embedding the program into the curriculum, into their school’s broader sustainability initiatives and connecting with their community. Watch the video to hear their highlights or read the full story here !
|
Stawell PS River Detectives Story
Stawell PS is a River Detectives school in the Wimmera CMA region exploring and testing waterways from local lakes to streams in Gariwerd (Grampians National Park). Watch the video to hear their highlights or read the full story here !
|
Bendigo Creek Citizen Science Project River Health Snapshots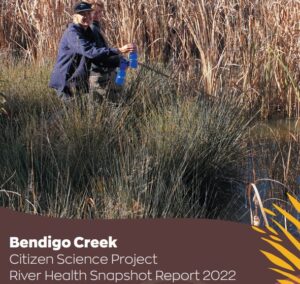
Gauge the health of the Bendigo Creek using this compilation of water quality and water bug data collected by citizen-scientists. To view and compare the 2021 report click here
|
Healthy Coliban Catchment Project River Health Snapshots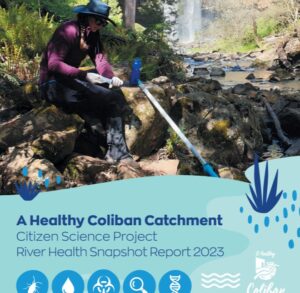
Gauge the health of waterways in the Healthy Coliban Catchment project area using this compilation of water quality and water bug data collected by citizen-scientists. You can also view and compare the 2022 or 2021 reports.
|
RiverScan Project River Health Snapshots
Gauge the health of waterways in the RiverScan project area using this compilation of water quality and water bug data collected by citizen-scientists. You can view and compare data in the 2021 and 2022 reports to track how things are changing.
|
Site Selection Checklist
When choosing your site along a waterway or at a wetland for citizen-science activities (water quality monitoring, waterbug sampling and habitat surveys) there are many things to consider. Please refer to this checklist to assist you.
|
The impact of animal poo on our waterways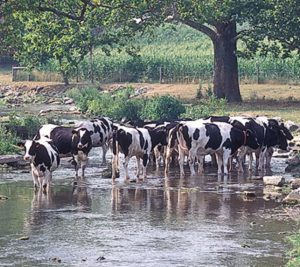
This article (and video) explains the impact animal poo has on our waterways and makes some interesting comparisons between the impact of native animal poo and exotic animal poo. The article is quite detailed but information can be extracted for younger students. The video is short and simple.
|
Nature-scrolling activity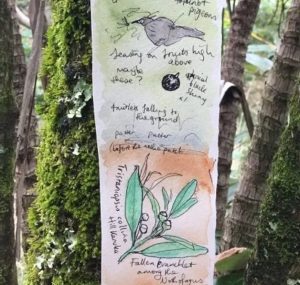
A nature scroll is simply a long, narrow piece of paper used to record your responses to nature, in words and pictures. It can be a portable, bite-sized alternative to nature journalling and a wonderful way for your students to engage with their local environment or make observations whilst at your adopted water testing site. Make it scientific, make it artistic or both !
|
River Detectives Program School PlanUse this School Plan to start a conversation with colleagues delivering the River Detectives program in your setting. This is a great template to use at the start of the year with lots of useful questions to promote thinking and space to document the approach you plan to take. There is also a useful template for sharing your River Detectives data and experience with others at the end of a term/year.
|
River Rehab: Protecting Waterways From Livestock video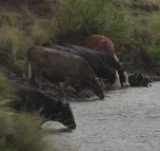
Watch this video to see how Tasmania’s farmers are taking measures to reduce degradation of the state’s waterways from livestock. This video introduces students to sustainable farming practices that protect waterways and increase farm productivity simultaneously. Draw your own farm plan and illustrate how it can be managed sustainably.
|
Make your own rain gauge video and experiment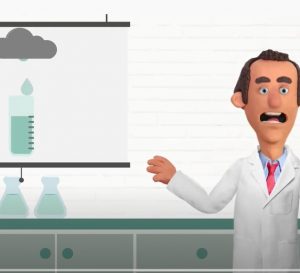
Join Wally the Water Scientist and Kristy from Goulburn Valley Water to learn how to make a rain gauge and why tracking rainfall is an interesting and informative activity. A great activity to connect maths, science and environmental learning.
|
Microplastics in our streams video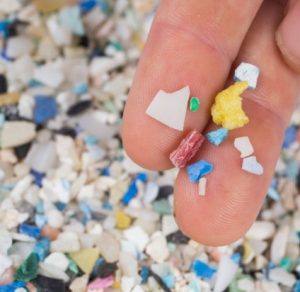
This video takes us on a journey with scientists conducting field research on the microplastics being washed down our waterways. It could provide inspiration to conduct research at your own waterway about the prevalence of these tiny but damaging pieces of pollution . . .
|
Water Quality Data Sheet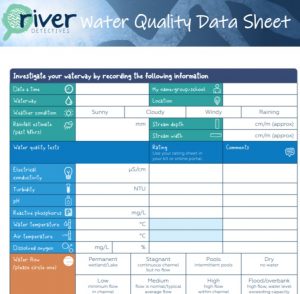
Use this data sheet on site or at school to record your water quality data each month. Make sure you enter your water science data online at the ‘Let’s Test and Record’ tab of this website.
|
River Detectives Field Manual
This is a copy of the Field Manual you receive a version of in your water quality test kit. If you lose your hard copy you can access it here. Be aware that this is the full manual – some pages may be irrelevant to you depending on the equipment you have and the region you are in.
|
Water Quality Rating Charts
Numbers are just numbers until you work out what they mean. Use the regional water quality rating chart from the Field Manual in your kit to compare your data for EC, turbidity, reactive phosphorus and pH to assess the health of your waterway. Or use the links below to print an enlarged copy for student use; Corangamite CMA, Melbourne Water, North East CMA, North Central CMA, Wimmera CMA
|
The Waterwatch Story
The North Central Waterwatch Program aims to increase the knowledge and skills of community, supporting them to become custodians of local waterways. River Detectives is the school/youth based component of the program. This video will help your students understand the community of passionate people that they belong to by being a River Detective.
|
Riparian Zone Poster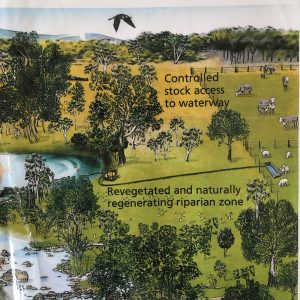
An excellent graphic to highlight the key features of a healthy riparian zone compared to a degraded riparian zone. Great for conversations about water quality, habitat health, land practices and shared community responsibility for the health of our waterways.
|
Water Quality Results Posters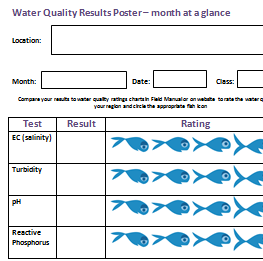
Use these posters to record and display your monthly or yearly results at a glance. Share them with others by printing in the school / community newsletter or displaying them in the classroom, school foyer or even a local shop or community meeting place.
|
pH Scale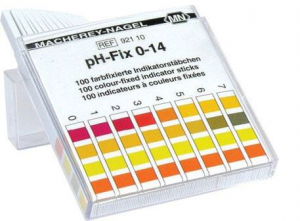
This graphic is the perfect tool to introduce pH, explain acidity and alkalinity to students and compare your pH reading to everyday household items.
|
Salinity Scale
Use this resource to check the salinity tolerances of humans, crops, livestock, compare your EC results and understand how salinity can impact on all areas of life.
|
Salinity in our waterways poster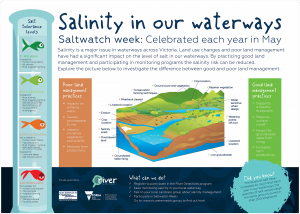
Use this poster to explore the issue of salinity and examine positive and negative land management practices that contribute to the issue.
|
Salinity – fact sheet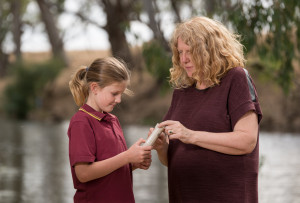
Salinity refers to the movement and concentration of salt through the landscape. Find out more here!
|
Algae fact sheet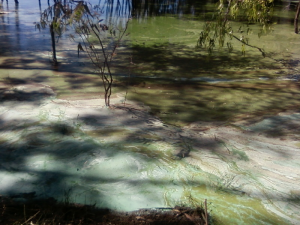
|
Phosphorus – fact sheet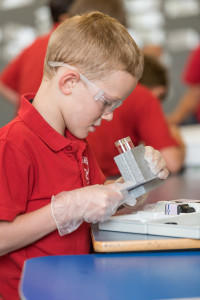
Your quick reference guide to all things phosphorus.
|
Blackwater Fact sheet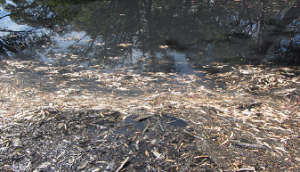
Find out about why water sometimes turns black!
|
Foam fact sheet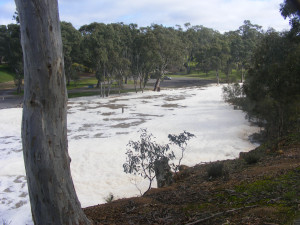
Find out how and why foam occurs in waterways.
|
Fresh and Salty Booklet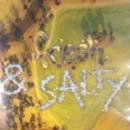
This booklet complements the Fresh and Salty video with teacher notes and lesson plans
|
Turbidity Fact Sheet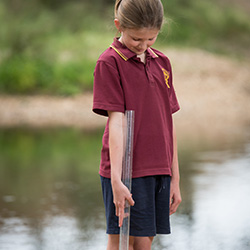
|
pH Fact sheet
|
Fresh and Salty video
Fresh and Salty is a highly engaging short animated film produced by the Wimmera CMA. It is the perfect way to introduce the topic of salinity to your students
|